


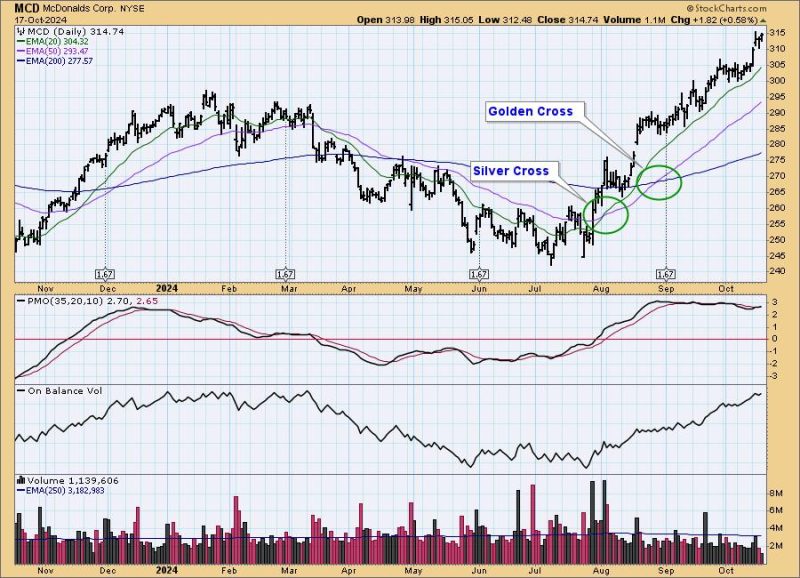
At DecisionPoint, we track intermediate-term and long-term BUY/SELL signals on twenty-six market, sector, and industry group indexes. The long-term BUY signals are based upon the famous Golden Cross, which is when the 50-day moving average crosses up through the 200-day moving average. (We use exponential moving averages — EMAs.) Intermediate-term BUY signals are based upon the 20-day moving average crossing up through the 50-day moving average, which we call a Silver Cross. On the McDonalds (MCD) chart below, you can see examples of each.
A caveat that comes with the signals is that they are information flags, not action commands. A new signal tells us to look at the chart and decide if any action is appropriate. In the case of these two crossovers, they were healthy-looking signals, with price showing clear changes of direction within each timeframe.
Next we have the DecisionPoint Market Scoreboard, which we publish daily in the DecisionPoint ALERT. It is current as of the close on October 17, 2024, and it is as good as it can get. This is good news and bad news. The good news is that the stock market is looking very healthy in terms of raw price action. The bad news is that the signal status is as good as it gets, and the pendulum will be swinging the other way, probably sooner than later.
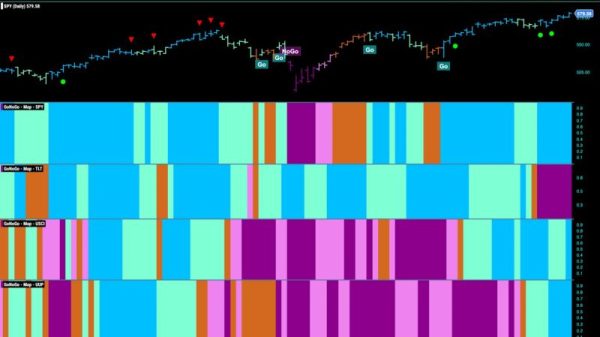
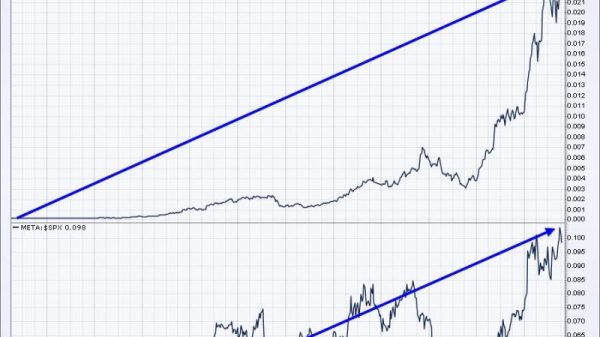
Along with the signal tracking, we have created the Silver Cross Index (SCI) and Golden Cross Index (GCI) for each of the market/sector indexes above. The Silver Cross Index shows the percentage of index components that are on a Silver Cross BUY signal. The Golden Cross Index shows the percentage of index components that are on a Golden Cross BUY signal.
The chart below is for the S&P 500 Index. Note that both the GCI and SCI show 80 percent of S&P 500 component stocks are on BUY Signals in both time frames. This is not as strong as in 2021, but it is very solid and partially backs up what we see on the DecisionPoint Market Scoreboard.
Conclusion: We check these charts every day, and are always aware of developing weakness and potential for signals to change. In the last few weeks, I found the picture to be unusually stable, and currently with no immediately impending signal changes. This, of course, could change in a heartbeat, but, for the moment, calm prevails. As I said, when things are as good as they can get, we should be alert for conditions to start deteriorating, but so far, so good.
Introducing the new Scan Alert System!
Delivered to your email box at the end of the market day. You’ll get the results of our proprietary scans that Erin uses to pick her “Diamonds in the Rough” for the DecisionPoint Diamonds Report. Get all of the results and see which ones you like best! Only $29/month! You can also use our free trial to try it out for two weeks using coupon code: DPTRIAL2. Click HERE to subscribe NOW!
Learn more about DecisionPoint.com:
Watch the latest episode of the DecisionPointTrading Room on DP’s YouTube channel here!
Try us out for two weeks with a trial subscription!
Use coupon code: DPTRIAL2 Subscribe HERE!
Technical Analysis is a windsock, not a crystal ball. –Carl Swenlin
(c) Copyright 2024 DecisionPoint.com
Disclaimer: This blog is for educational purposes only and should not be construed as financial advice. The ideas and strategies should never be used without first assessing your own personal and financial situation, or without consulting a financial professional. Any opinions expressed herein are solely those of the author, and do not in any way represent the views or opinions of any other person or entity.
DecisionPoint is not a registered investment advisor. Investment and trading decisions are solely your responsibility. DecisionPoint newsletters, blogs or website materials should NOT be interpreted as a recommendation or solicitation to buy or sell any security or to take any specific action.
Helpful DecisionPoint Links:
Trend Models
Price Momentum Oscillator (PMO)
On Balance Volume
Swenlin Trading Oscillators (STO-B and STO-V)
ITBM and ITVM
SCTR Ranking
Bear Market Rules