


The Cybersecurity ETF (CIBR) is resuming the lead as it surged to new highs this past week. It is important to note that CIBR began its leadership role a lot earlier because it hit a new high in late August. Today’s report will analyze the recent breakout and suggest some possibilities in the future.
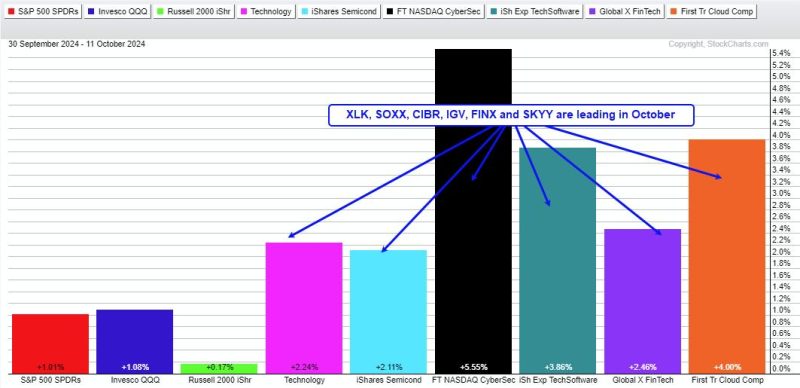
First notice that the Technology SPDR (XLK) and five tech-related ETFs are leading in October (semis, cybersecurity, software, fintech and cloud). They are up 2% or more and easily outperforming the major index ETFs (SPY,QQQ,IWM). The tech ETFs underperformed in July-August and are now getting their mojo back.
I featured CIBR in Art’s Charts on September 14th, demonstrating how to use the Percent above MA (5, 200) to define the trend and reduce whipsaws. In an long-term uptrend, stocks and ETFs experience both trending and non-trending periods, with the latter often lasting longer.
The chart below shows CIBR trending higher from late October 2023 to mid-February 2024, less than four months. A non-trending period followed and lasted over six months. Most recently, the ETF broke out of this range and entered a new trending period. I expect this trending period to last a few months and prices to extend higher.
The breakout zone around 59 (red line) turns into the first support area to watch in case of a throwback. Throwbacks occur when prices fall back to the resistance zone after a breakout. Overall, support is marked in the 59-60 area, and a pullback to this zone would provide a second chance to participate in the breakout.
TrendInvestorPro is focused CIBR, tech-related ETFs and tech stocks as they move from corrective non-trending periods to trending periods. We think the market is looking past the elections and toward seasonal patterns, which soon turn bullish. Opportunity awaits! Click here to learn more.
Special Offer!!
2 Educational Reports/Videos with Every Subscription
“Finding Bullish Setup Zones with High Reward Potential and Low Risk”. The trend is your friend, and pullbacks within uptrends present opportunities. We show how to find compelling setups that combine market conditions, trend identification, oversold conditions and trading patterns. Trading is all about the odds and these setups put the odds in your favor.
“Using Breadth for Capitulation, Thrusts, Market Regime and Oversold Conditions”. This report covers four ways to utilize breadth indicators. Capitulation conditions often signal major lows, while thrust signals indicate the start of a bullish phase. Market regime helps distinguish between bull and bear markets, and oversold conditions identify tradable pullbacks within bull markets. We explain the indicators, settings, and signals for each scenario.
Click here for immediate access!
Highlights from Recent Weekly Reports/Videos:
October 4th Report: We identified bullish breakouts in several tech-related ETFs (QQQ, XLK, MAGS). Additionally, we noted continued strong performance from software and cybersecurity (IGV, CIBR). The report also showcased bullish continuation patterns for three leading AI stocks and identified two bullish setups in the healthcare sector.
September 19th Report: We began with our breadth model, which has maintained a bullish stance since December 7th. Narrowing yield spreads continue to show confidence in the credit markets. The report featured bullish setups in ETFs related to copper, base metals, copper miners, and palladium (CPER, DBB, COPX, PALL).
Click here for immediate access!
/////////////////////////////////////////////////