


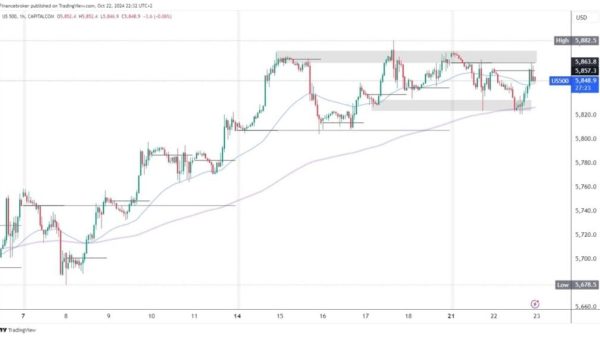


S&P 500 and Nasdaq: S&P 500 has resistance at 5860.0 zone
The EMA 200 moving average proved to be excellent support for the S&P 500 index on Tuesday, October 22 Nasdaq managed to climb to a new weekly high at 20455.8 levelS&P 500 chart analysis
The EMA 200 moving average proved to be excellent support for the S&P 500 index on Tuesday, October 22. After support at the 5820.0 level, we saw the initiation of a bullish consolidation back to the daily open level of 5857.3. We even tested the weekly open level of 5863.8 but failed to hold on to that zone. The index again turned to the bearish side and retreated to 5845.0 levels. Here, we test the EMA 500 moving average.
Potential lower targets are 5840.0 and 5830.0 levels. If we get support from the EMA 50 moving average, the S&P 500 has a new opportunity to return above the daily open level and test today’s resistance in the 5865.0 zone. We need to stay there for further recovery on the bullish side. Potential higher targets are 5870.0 and 5880.0 levels.
Nasdaq chart analysis
Nasdaq managed to climb to a new weekly high at 20455.8 level. After three days, the index broke the resistance at the 20400.0 level. Although we did not stay above for long, the breakout is a good indicator that the Nasdaq has pretensions to move back to the bullish side. Potential higher targets are 20475.0 and 20500.0 levels.
For a bearish option, we need a pullback below the 20300.0 level. With that step, the index moves below the weekly open level to the negative side. After that, pressure builds for a further pullback to 20250.0 and the EMA 200 moving average. This week, the moving average managed to hold the price above on the positive side and produce a bullish consolidation in the previous two cases. This time, we hope for a breakout below and a new daily low formation. Potential lower targets are 20225.0 and 20000.0 levels.
The post S&P 500 and Nasdaq: S&P 500 has resistance at 5860.0 zone appeared first on FinanceBrokerage.